6.2 - Who is the APIDA Community?
The Asian American Education Project
All content is owned by The Asian American Education Project (AAEdu). As such, users agree to attribute all work to The Asian American Education Project.
Credit: The Asian American Education Project
Grade: 9-12Subject:
English Language Arts, Social Studies, U.S. History
The term APIDA is an acronym for Asian Pacific Islander Desi American and is used to refer to people with Asian, Pacific Islander, and/or South Asian ancestry. In this lesson, students will learn about the different ethnicities included in the APIDA identifier. They will explore the benefits and issues with different identifiers for the APIDA community. Students will examine data and learn about the importance of disaggregated data.
Students will:
- Explain who is part of the APIDA community.
- Describe the history, benefits, and problems of different identifiers for the APIDA community.
- Analyze disaggregated data to illuminate possible inequities experienced by different subgroups.
- Propose ways to address inequities or harm caused by aggregated data or generalizations made about the APIDA community as a whole.
Who is the APIDA Community? Essay
Asian Pacific Islander Desi Americans (APIDA) are among the fastest growing population groups in the United States. In addition to APIDA, there are many other “
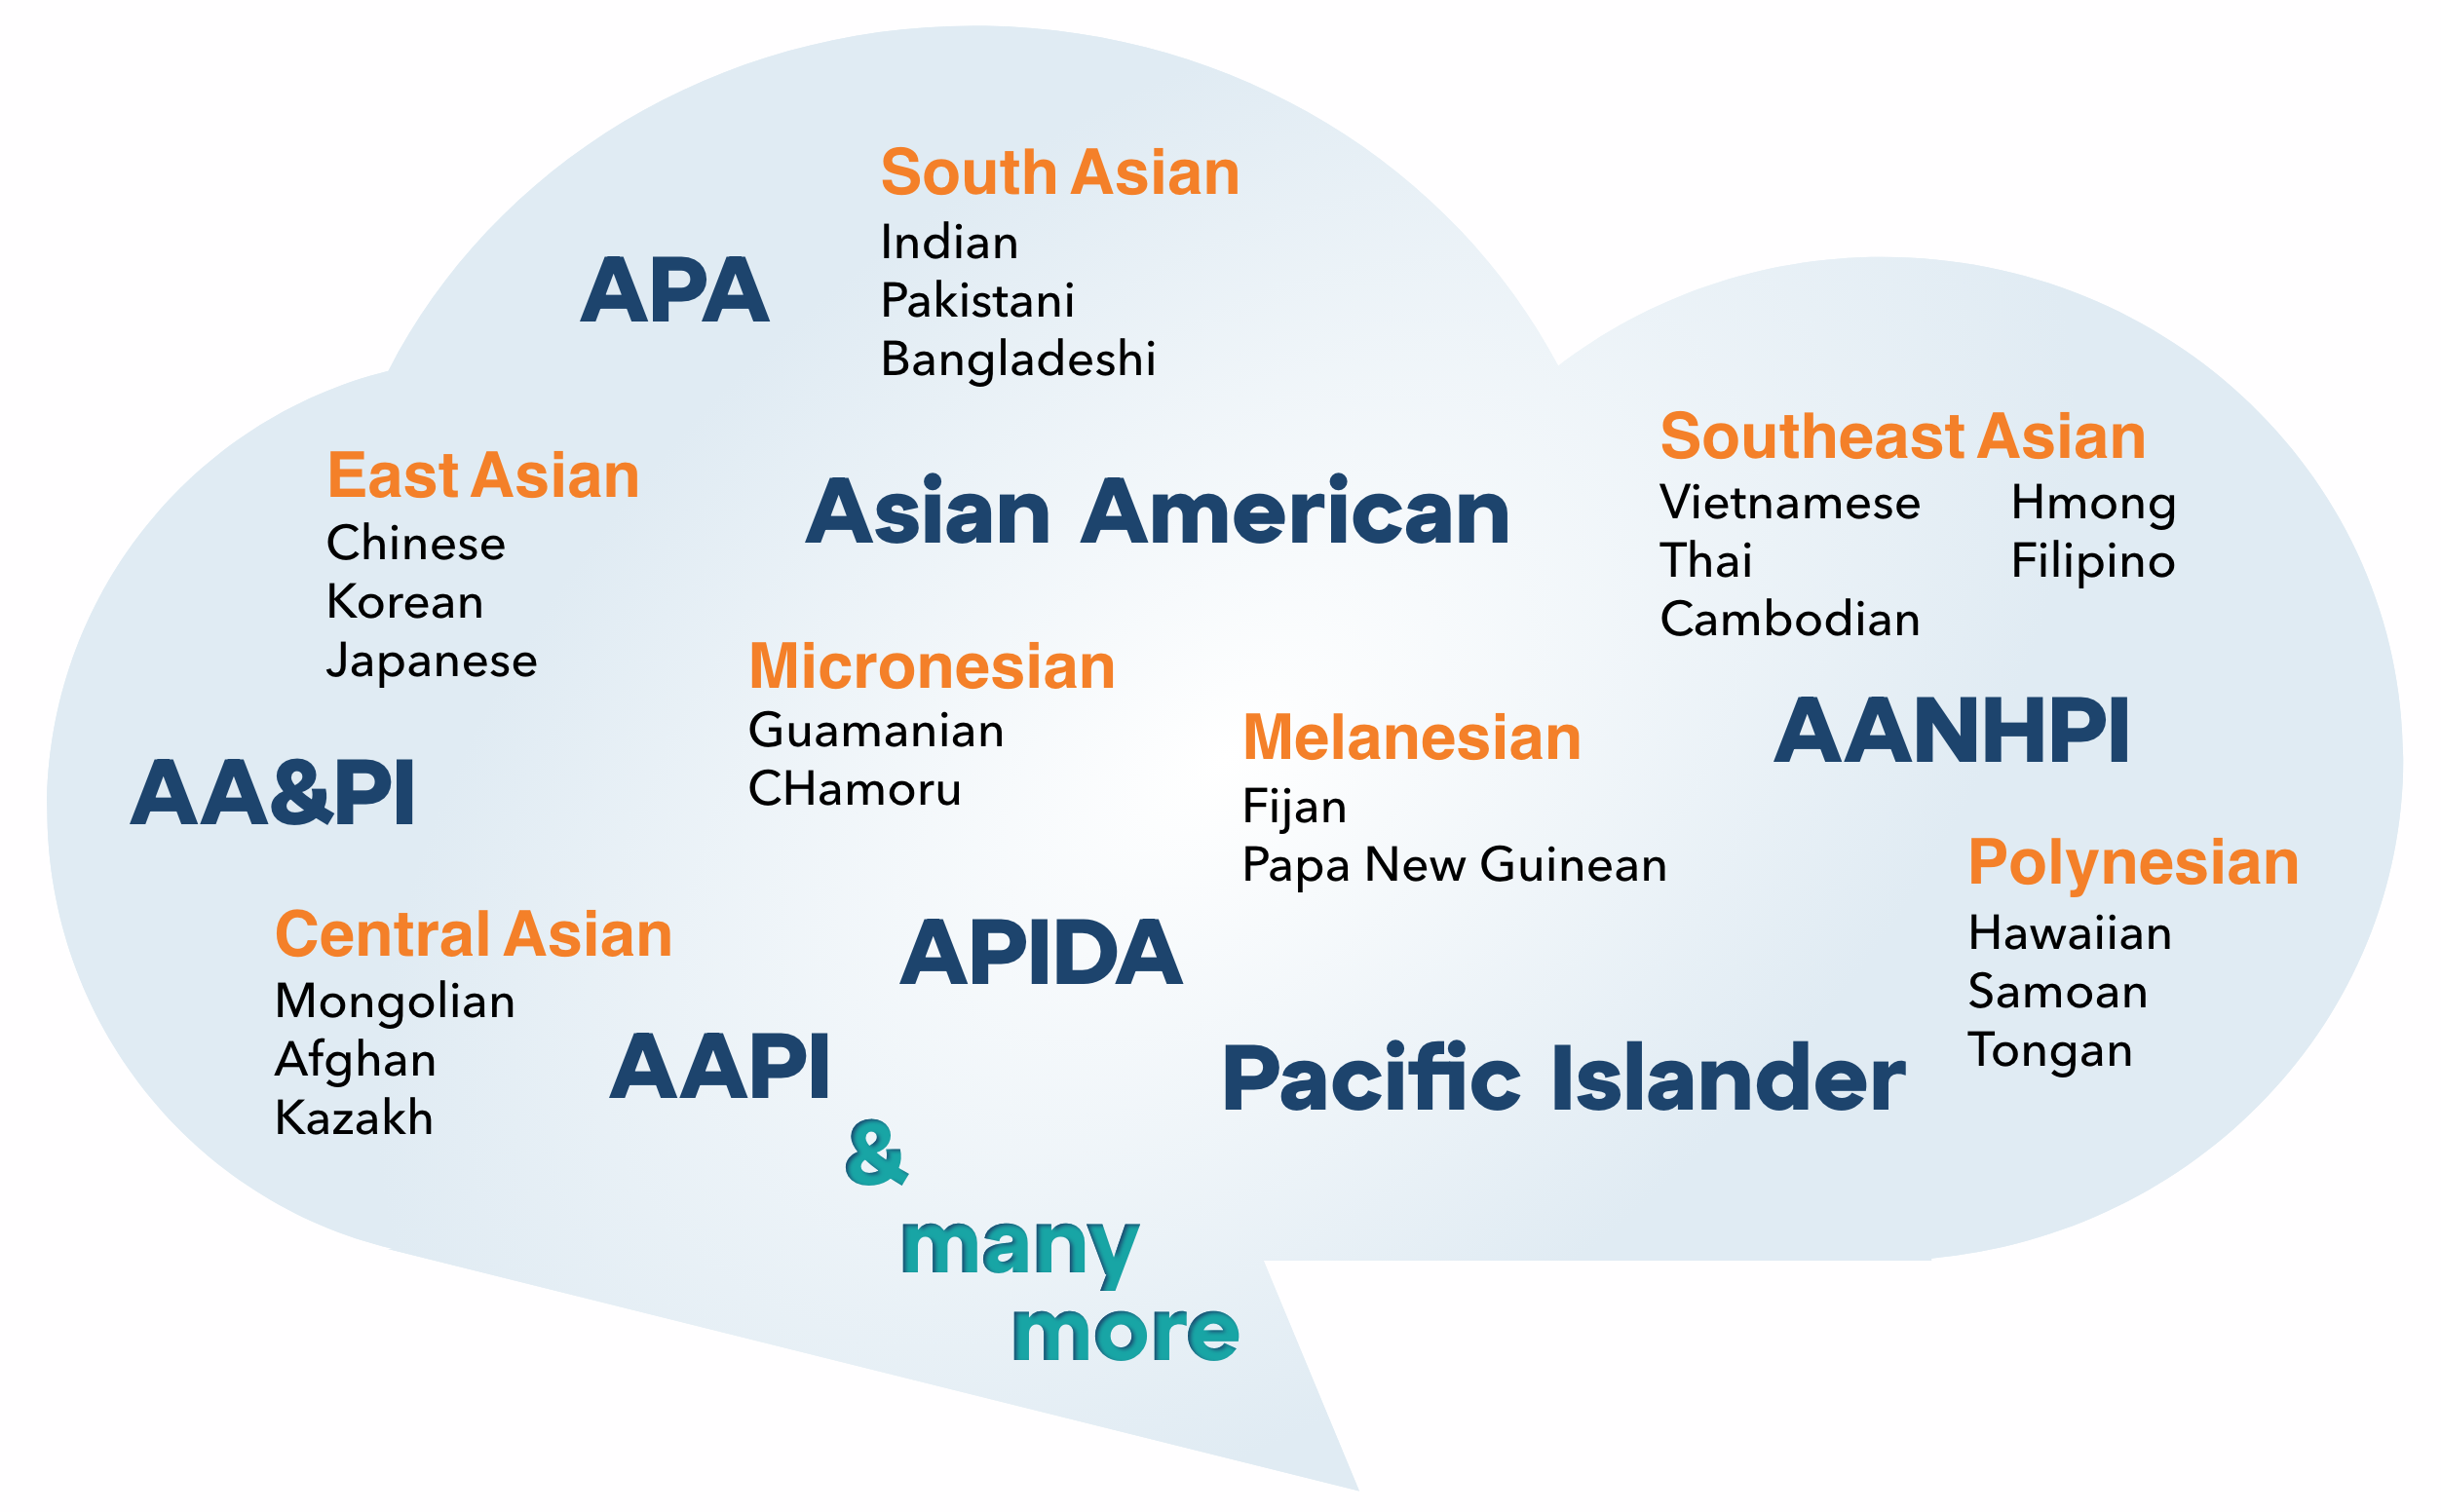
umbrella” terms used to refer to this population. For example, AAPI (Asian American Pacific Islander) is commonly used. However, some organizers in the Pacific Islander community prefer to use AA & PI instead. They use the “and” sign in order to be seen as a distinct group. Similarly, South Asians also fight for visibility. As such, APIDA is a more inclusive term; it is an acronym for Asian Pacific Islander Desi American. A
pan-ethnic identifier, APIDA explicitly names Desi Americans. “Desi” is an umbrella term for South Asians that emerged from grassroots South Asian American spaces in the 1990s. Desi is a
Sanskrit word meaning “land” or “country.” Other terms include Asian Pacific American (APA) and Asian American Native Hawaiian Pacific Islander (AANHPI).
These multiple identifiers demonstrate the incredible
diversity under the APIDA umbrella. This includes but is not limited to people with heritages from East Asia, Southeast Asia, Central Asia, South Asia, Hawai
ʻi, and the Pacific Islands. Within these regional identifiers, there is even more diversity. As there are over 40 countries in Asia, each country may include multiple ethnic identities. Consider the following:
- East Asian Americans make up the largest group of Asian Americans. The Chinese began immigrating in large numbers to the United States as laborers in the 1800s. As such, Chinese American history tends to be the most prominent. Immigration amongst other East Asians increased greatly after the Immigration and Nationality Act of 1965.
- A large portion of Southeast Asians Americans arrived as refugees following the Vietnam War and other conflicts in Southeast Asia after 1975.
- Central Asia is a subregion of Asia spanning east of the Caspian Sea to Mongolia. Many Central Asians immigrated to the United States after 1991 after the collapse of the Soviet Union. Some also arrived as refugees beginning in the 1970s.
- South Asian Americans refer to people whose heritage hail from the Indian subcontinent and its surrounding areas. Similar to East Asians, many South Asians came to the United States as laborers in the 1880s. Their numbers increased dramatically after the Immigration and Nationality Act of 1965.
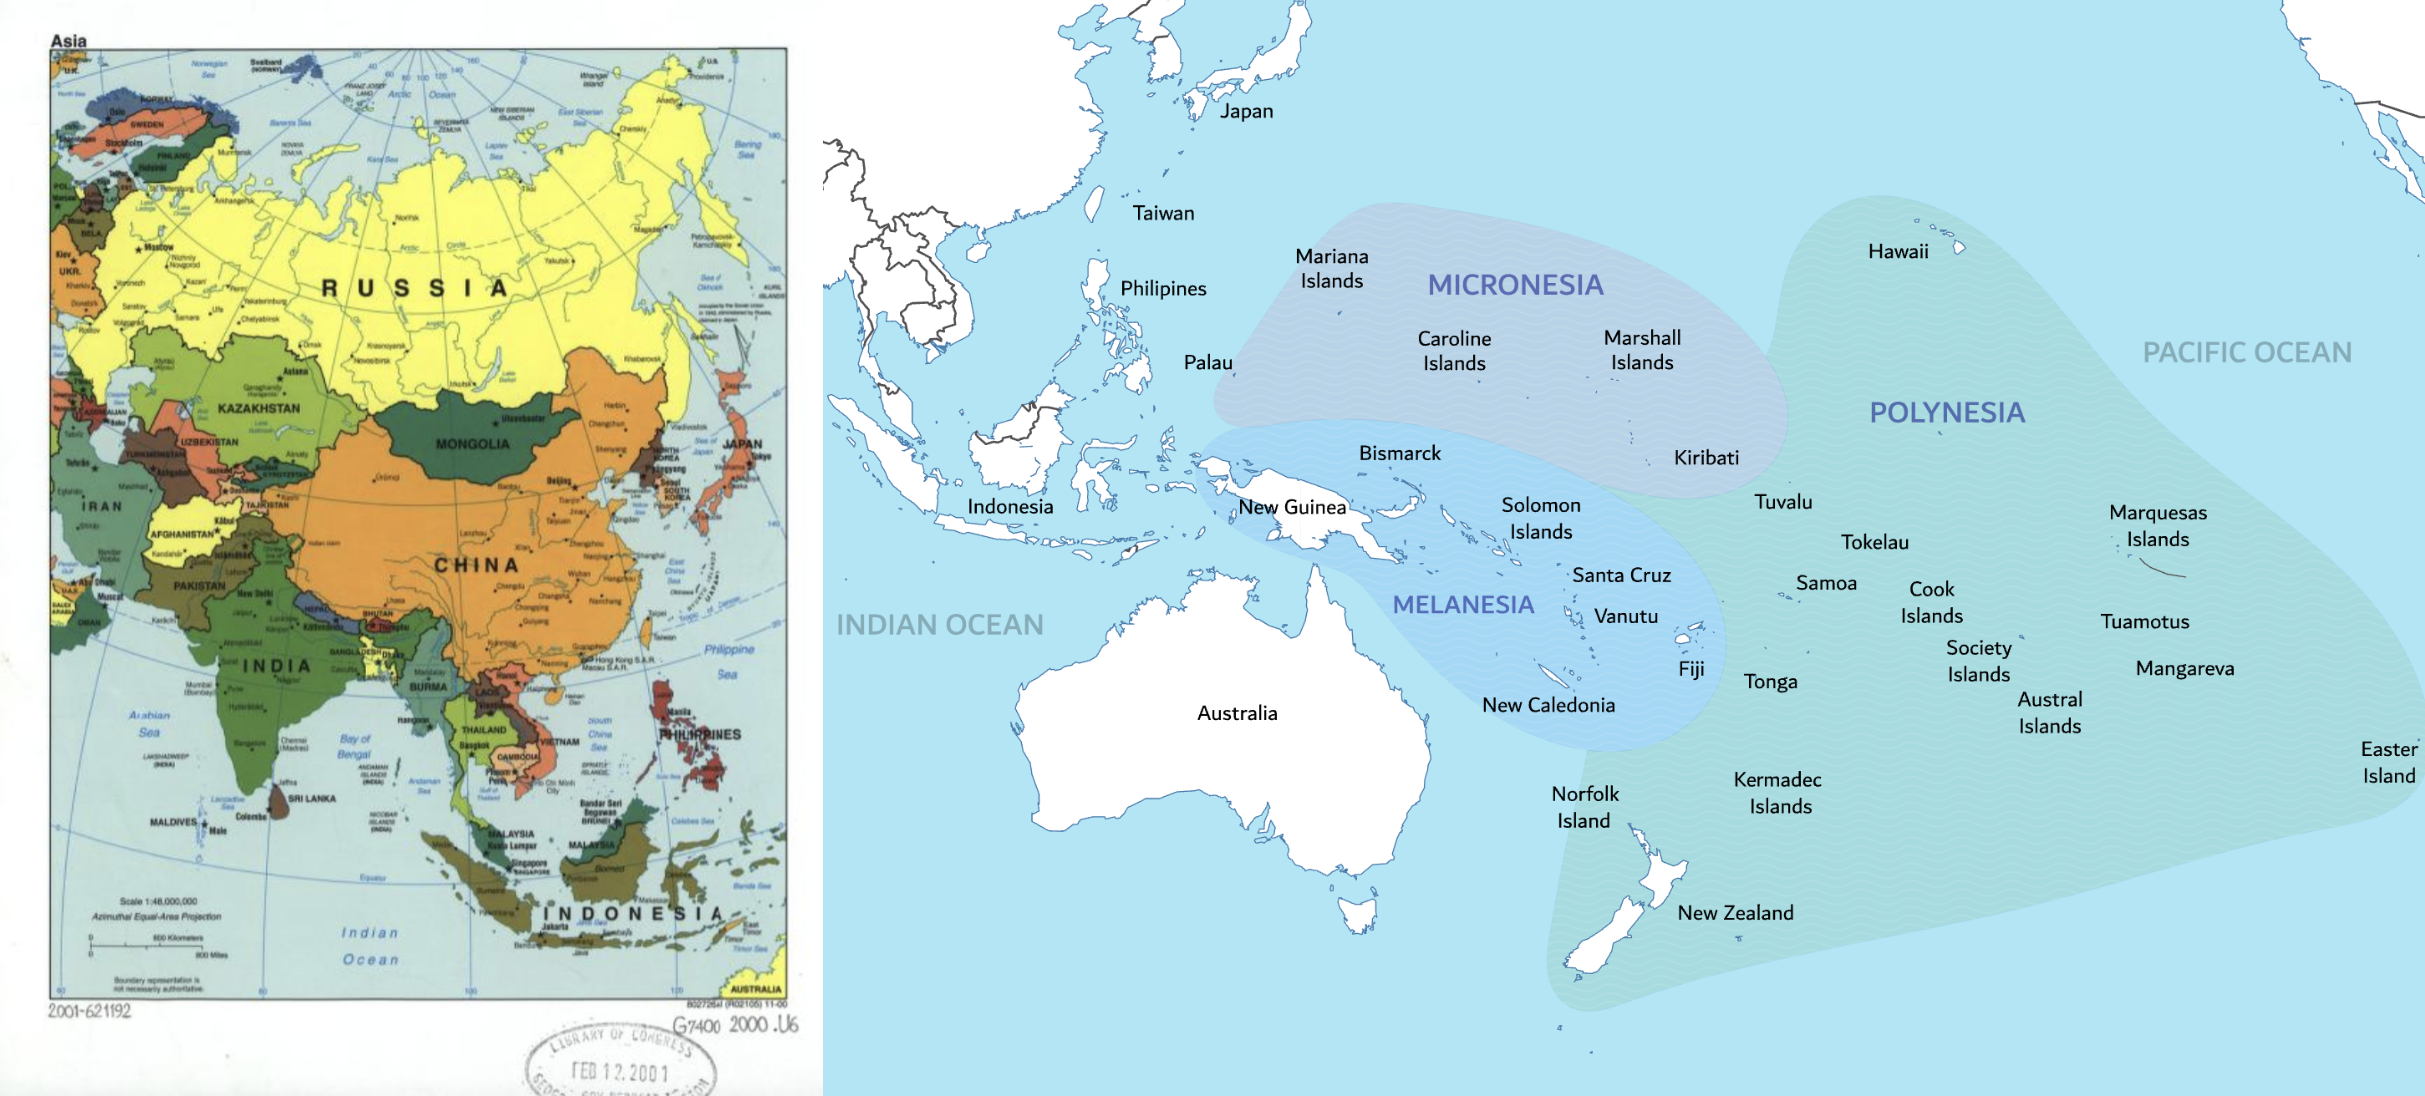
- Pacific Islands include thousands of islands located in the Pacific Ocean that are organized in three ethnogeographic groupings: Melanesia, Micronesia, and Polynesia. Melanesian islands are located north and east of Australia and south of the Equator. Micronesian islands are north of Melanesia and the Equator and east of the Philippines. Polynesian islands are located in the central and southern Pacific Ocean.
It is important to note the final “A” in APIDA stands for American. When referring to the APIDA community, this generally includes the unique experiences of those with Asian or Pacific Islander heritage residing in the United States. This includes recent immigrants and those with multi-generational lineage. It includes both citizens and non-citizens. It can also include individuals who are in the United States temporarily, such as international students or those with a work visa. Being “American” is distinct from being “Asian.” For example, a Chinese American may have more in common with a White American than a person living in China.
According to the 2020 United States Census, 20.6 million people, or 6.2% of the nation’s population, self-identify as Asian, Native Hawaiian, or Other Pacific Islander. The Census Bureau is required to use the standards on race and ethnicity set by the 1997 Office of Management of Budget (OMB), which defines these terms as:
- Asian – A person having origins in any of the original peoples of the Far East, Southeast Asia, or the Indian subcontinent including, for example, Cambodia, China, India, Japan, Korea, Malaysia, Pakistan, the Philippine Islands, Thailand, and Vietnam.
- Native Hawaiian or Other Pacific Islander – A person having origins in any of the original peoples of Hawaii, Guam, Samoa, or other Pacific Islands.
These Census-defined categories can be limiting. It is important to acknowledge that race, ethnicity, and identity can be fraught, and who falls under which terms is not uniformly agreed upon. No community is
homogenous, and there can be a vast range of experiences from one individual to the next. How one identifies is ultimately an individual choice, and many individuals do not self-identify with Census-defined categories. While people may view Census definitions as “official,” they are constantly debated and can change over time. (One significant factor is that many people today identify as multi-racial so these categories are often incomplete.)
Descriptors like APIDA can be politically contentious, and individuals may feel differently about which terms they would like to identify with, which can also vary in different contexts. The term “Asian American” emerged in the 1960s to unify Asian Americans and build political power. It was coined by Yuri Ichioka (1936-2002) and Emma Gee (died 2023) at the University of California, Berkeley, who formed the Asian American Political Alliance (AAPA). Inspired by the Black Power movement, Ichioka and Gee sought to unify students of Chinese, Japanese, Filipino, and Korean descent, who previously identified primarily by their country of origin. The term “Asian American” was also meant to push back on racial slurs like “Oriental” that were common at the time. By unifying as a pan-Asian block, Asian Americans could also build coalitions with Black communities and other communities of color.
Terminology is constantly evolving and debated. For example, there is debate around whether the term Middle Eastern and North African (MENA) or Southwest Asian and North African (SWANA) is preferred to describe the region from Morocco to Afghanistan, and exactly which countries fall into either of these terms. Furthermore, there is discourse among people with heritage from these countries currently residing in the United States around whether or not they identify as Asian Americans. (In general, it is important to respect how people choose to self-identify.)
As the Asian American population in the United States has grown and changed, the Asian American community has had to reconcile with how to adapt and create an inclusive and unifying movement that addresses the needs of all of its members. While umbrella terms like Asian American and APIDA can be powerful as a political strategy that unites many groups to fight for a common cause, understanding the APIDA community often requires looking under the umbrella and
disaggregating data to best illuminate how different issues impact different communities. Disaggregating data also allows policy makers and others in positions of power to better understand the needs and concerns of various communities. They can make informed decisions to address these needs and distribute resources accordingly.
* Pacific Islander inclusion in identifiers for the APIDA community is examined in The Asian American Education Project lesson entitled, “Pacific Islanders and U.S. Colonization.”
Bibiliography:
Budiman, Abby and Ruiz, Neil G. “Asian Americans are the fastest growing racial or ethnic group in the U.S.”
Pew Research Center, 9 April 2021,
https://pewrsr.ch/3tbjILO. Accessed 15 August 2023.
- Disaggregate: to separate into component parts
- Diversity: having many different elements, especially having people of different races or ethnicities
- Ethnogeographic: geographical distribution of races or ethnic groups
- Homogenous: the same throughout
- Immigrant: a person who comes to a country to live permanently
- Pan-ethnic: grouping various ethnic groups together
- Refugee: a person who flees a country to escape danger or persecution
- Sanskrit: the classical language of India and of Hinduism
- Umbrella: something that covers a broad range of elements
- What groups are included in the “APIDA” label? What definitions and terminology do the U.S. Census Bureau use in their data collection?
- What are the limitations of Census definitions and terminology?
- When might it be beneficial to refer to APIDAs as a whole, and what are possible drawbacks?
- When might it be beneficial to breakdown by specific subgroups, and what are possible drawbacks?
- Why is it important to disaggregate data?
Maps of Asia and the Pacific Islands. APIDAs are not a monolith and include people from many different countries, communities, cultures, heritages, and histories.
Credit (left image): Library of Congress, Geography and Map Division (Public Domain Image)
Source
Credit (right image): “A map of Pacific ocean shows Oceania continent with major islands, culture areas are highlighted” by comersis.com, via Wikimedia Commons (
CC BY-SA 4.0)
Source
Activity 1: Mapping APIDA Heritage Countries
- Have students work in small groups and assign each group one of the regions in the chart below. Have students complete the worksheet entitled, “APIDA Regions” by looking up information and maps online.
- Display the chart below for all students to see. Have small groups share their findings and identify their region on a world map. Record key information in the chart and have students annotate accordingly on their worksheets.
| |
Which countries are included in this region? |
What are some unique geographic features of this region? |
What are some unique cultural features of this region? |
East Asia |
|
|
|
Southeast Asia |
|
|
|
Central Asia |
|
|
|
South Asia |
|
|
|
Pacific Islands: Micronesia |
|
|
|
Pacific Islands: Melanesia |
|
|
|
Pacific Islands: Polynesia |
|
|
|
Activity 2: Learning About the APIDA Community
- Have students read the essay. Facilitate a discussion (see Discussion Questions) about the essay to ensure comprehension.
- Have students use information from the essay to complete the worksheet entitled, “Identifiers for the APIDA Community.” Have students conduct internet research for additional information. (Refer to the essay and resources in The Asian American Education Project lesson entitled, “Pacific Islanders and U.S. Colonization” for more information.)
- Facilitate a discussion using the following questions:
- How have the various identifiers changed over time?
- What are the overall benefits of umbrella terms?
- What are the overall limitations or challenges with umbrella terms?
- Beyond naming, what can communities do to ensure inclusion of various groups?
- Optional: For students who identify as Asian American and/or Pacific Islander, which terms resonate with you the most? Why? (Note: It is important to give students who identify as Asian American and/or Pacific Islander an opportunity to share their perspective here. However, they should not feel pressure to share or be the “spokesperson” for the APIDA perspective.)
Activity 3: Examining the Data
- Have students use the AAPI Data report entitled, “State of Asian Americans, Native Hawaiians, and Pacific Islanders in the United States June 2022,” which presents both aggregated and disaggregated national data.
- Have students look at “Figure 22: Educational Attainment by Race/Ethnicity” on page 48.
- Explain that this graph shows educational attainment by race/ethnicity as defined by the U.S. Census.
- Have students make observations about the graph.
- Have students look at the rows for “Asian alone” and “Native Hawaiian and Pacific Islander alone.” Ask students, “What does the data in these two rows suggest? How might this data be used to inform policy decisions?”
- Have students look at “Figure 23: Educational Attainment by Detailed Asian National Origin” on page 49 and “Figure 24: Educational Attainment by Detailed NHPI National Origin” on page 50.
- Have students make observations about the graphs.
- Ask students, “How does this data tell a different story from data in Figure 22? How might this data lead to different policy decisions?”
Activity 4: Disaggregating Data
- Tell students that “aggregate” refers to the whole, and “disaggregate” means to separate into component parts, so disaggregating data means breaking down data into detailed sub-groups.
- Have students read the introduction and “Context on race and ethnicity data collection” section in the article entitled, “Strengthening Federal Data Will Better Serve Communities of Color.”
- Facilitate a discussion using the following questions:
- What are some of the reasons the federal government collects data on race and ethnicity?
- What was the impact of the 1997 revisions to its race and ethnicity standards?
- Why do the authors argue that the 1997 standards did not go far enough?
- Have students consider these points from the article:
- 56% of Asian Americans have a bachelor’s degree or higher
- 14% of Burmese Americans have a bachelor’s degree or higher
- 15% of Hmong and Laotian Americans have a bachelor’s degree or higher
- 17% of Cambodian Americans have a bachelor’s degree or higher
- Ask students: What is the significance of disaggregating the data? What does the disaggregated data show that the aggregated data hides? How might the disaggregated data inform policy decisions?
- Have students use the AAPI Data Community Data Hub to generate data about the APIDA community. Have them generate both aggregated and disaggregated data. Have students research their specific city, county, or state. Have students choose a specific category to study:
- Educational attainment
- Health insurance
- Language
- Poverty status
- Native born or foreign born
- Household income
- Internet access
- Tenure/Home ownership
- Have students interpret the data they found and give a snapshot of the community they researched. Have students create a slide deck to present their findings for a mock town hall. Explain that students are presenting their data and analysis to stakeholders including community members and policymakers. Tell students to address the following questions in their analysis:
- What does the disaggregated data reveal?
- How do different subgroups’ experiences differ?
- Are there inequities experienced by different subgroups? What are possible explanations for these inequities?
- How might community members or policymakers work to address the concerns that the disaggregated data shows?
Activity 5: Connecting to the Model Minority Myth
- Have students read The Asian American Education Project essay entitled, “Model Minority Myth” and/or watch The Model Minority Myth video.
- Have students define the Model Minority Myth. Write their ideas on the board, and add any additional information to capture this basic definition: The Model Minority Myth casts APIDAs as prime examples of representing the American values of opportunity, meritocracy, and the American Dream.
- Ask students what connections they see between the Model Minority Myth and the importance of disaggregated data. Ask the following questions to help students make the connection:
- What information might aggregate data hide that disaggregated data may reveal?
- How might using aggregated data perpetuate the Model Minority Myth?
- How might some groups be harmed by aggregate data that perpetuates the Model Minority Myth?
- Based on your research from Activity 4, do you see any ways in which the Model Minority Myth is perpetuated with aggregated data? What about disaggregated data?
- Have students write an essay to connect all the pieces they have learned in this lesson. Tell students their essays should address:
- Who is the APIDA community? Why is it important to understand what subgroups are a part of this community?
- What is disaggregated data and how does it help us better understand the APIDA community?
- What is the Model Minority Myth? How can better understanding who is part of the APIDA community help combat the Model Minority Myth?
- How does disaggregating data dispel the Model Minority Myth?
- Have students examine the historical timeline entitled, “What Census Calls Us.” Have students determine what terms have been used to name APIDA communities (as well as other communities) and how these terms have changed over time. Facilitate a discussion about how terminology can change over time, and what this tells us about “official” definitions.
- Have students dig deeper into the grouping of Pacific Islanders with Asian Americans by implementing The Asian American Education Project lesson entitled, “Pacific Islanders and U.S. Colonization.”
CCSS.ELA-LITERACY.RH.9-10.2
Determine the central ideas or information of a primary or secondary source; provide an accurate summary of how key events or ideas develop over the course of the text.
CCSS.ELA-LITERACY.RH.11-12.1
Cite specific textual evidence to support analysis of primary and secondary sources, connecting insights gained from specific details to an understanding of the text as a whole.
CCSS.ELA-LITERACY.RH.9-10.7
Integrate quantitative or technical analysis (e.g., charts, research data) with qualitative analysis in print or digital text.
CCSS.ELA-LITERACY.RH.11-12.7
Integrate and evaluate multiple sources of information presented in diverse formats and media (e.g., visually, quantitatively, as well as in words) in order to address a question or solve a problem.